Results processing
HemeLB stores output data in a compressed *.dat file. To make this human-readable use the hemeXtract tool provided in the download files. There are multiple options for how files can be convertedbut the most straightforward is:
hemeXtract -X output.dat > readable-output.txt
Where output.dat is the address of the file you wish to convert and readable-output.txt is the file to which it is converted too.
The readable-output.txt file contains all the data from the simulation. To observe transient evolution of a model, or results at a specific step, it can be easier to split this into separate files for each output step. This can be achieved with the provided paraviewProcessing.sh script. This splits the readable-output.txt file into sequentially numbered paraview-file-name text files.
bash paraviewProcessing.sh readable-output.txt paraview-file-name
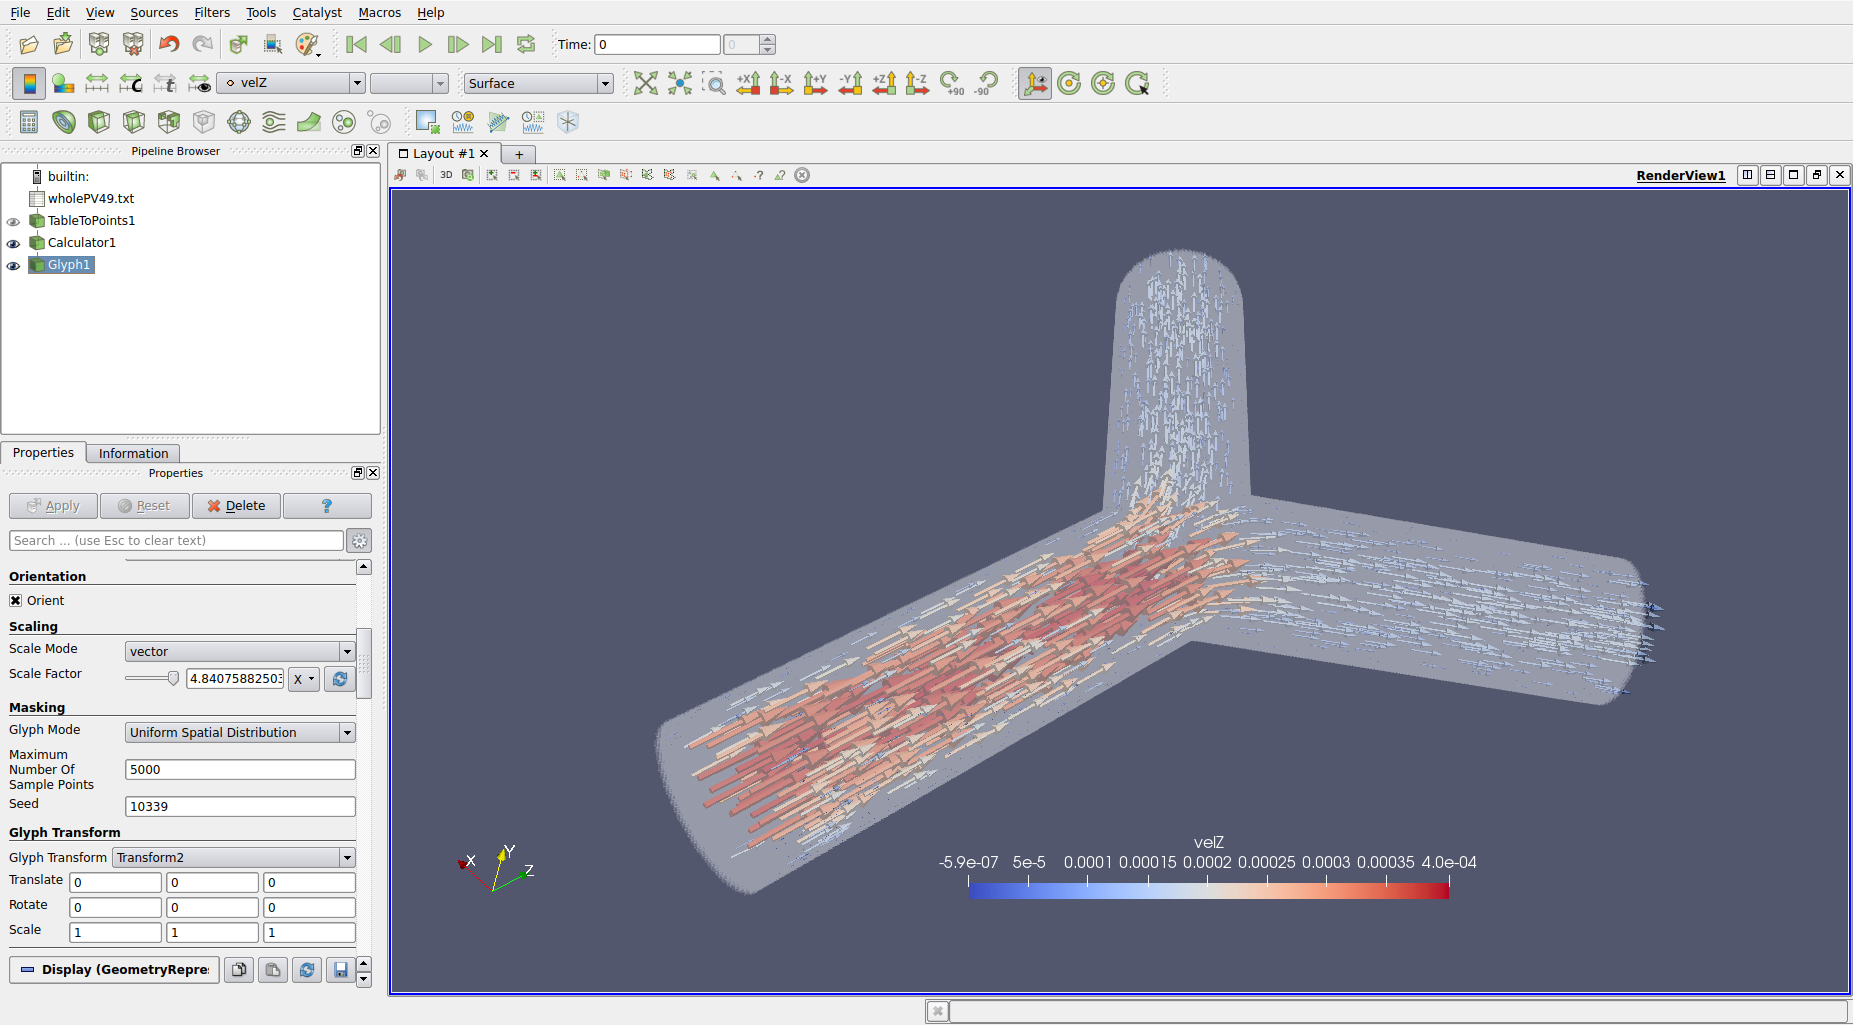
Whilst many visualisation softwares are available, this tutorial will use Paraview. This toolkit is one of the more widely used in the scientific fields.
Visualising results
-
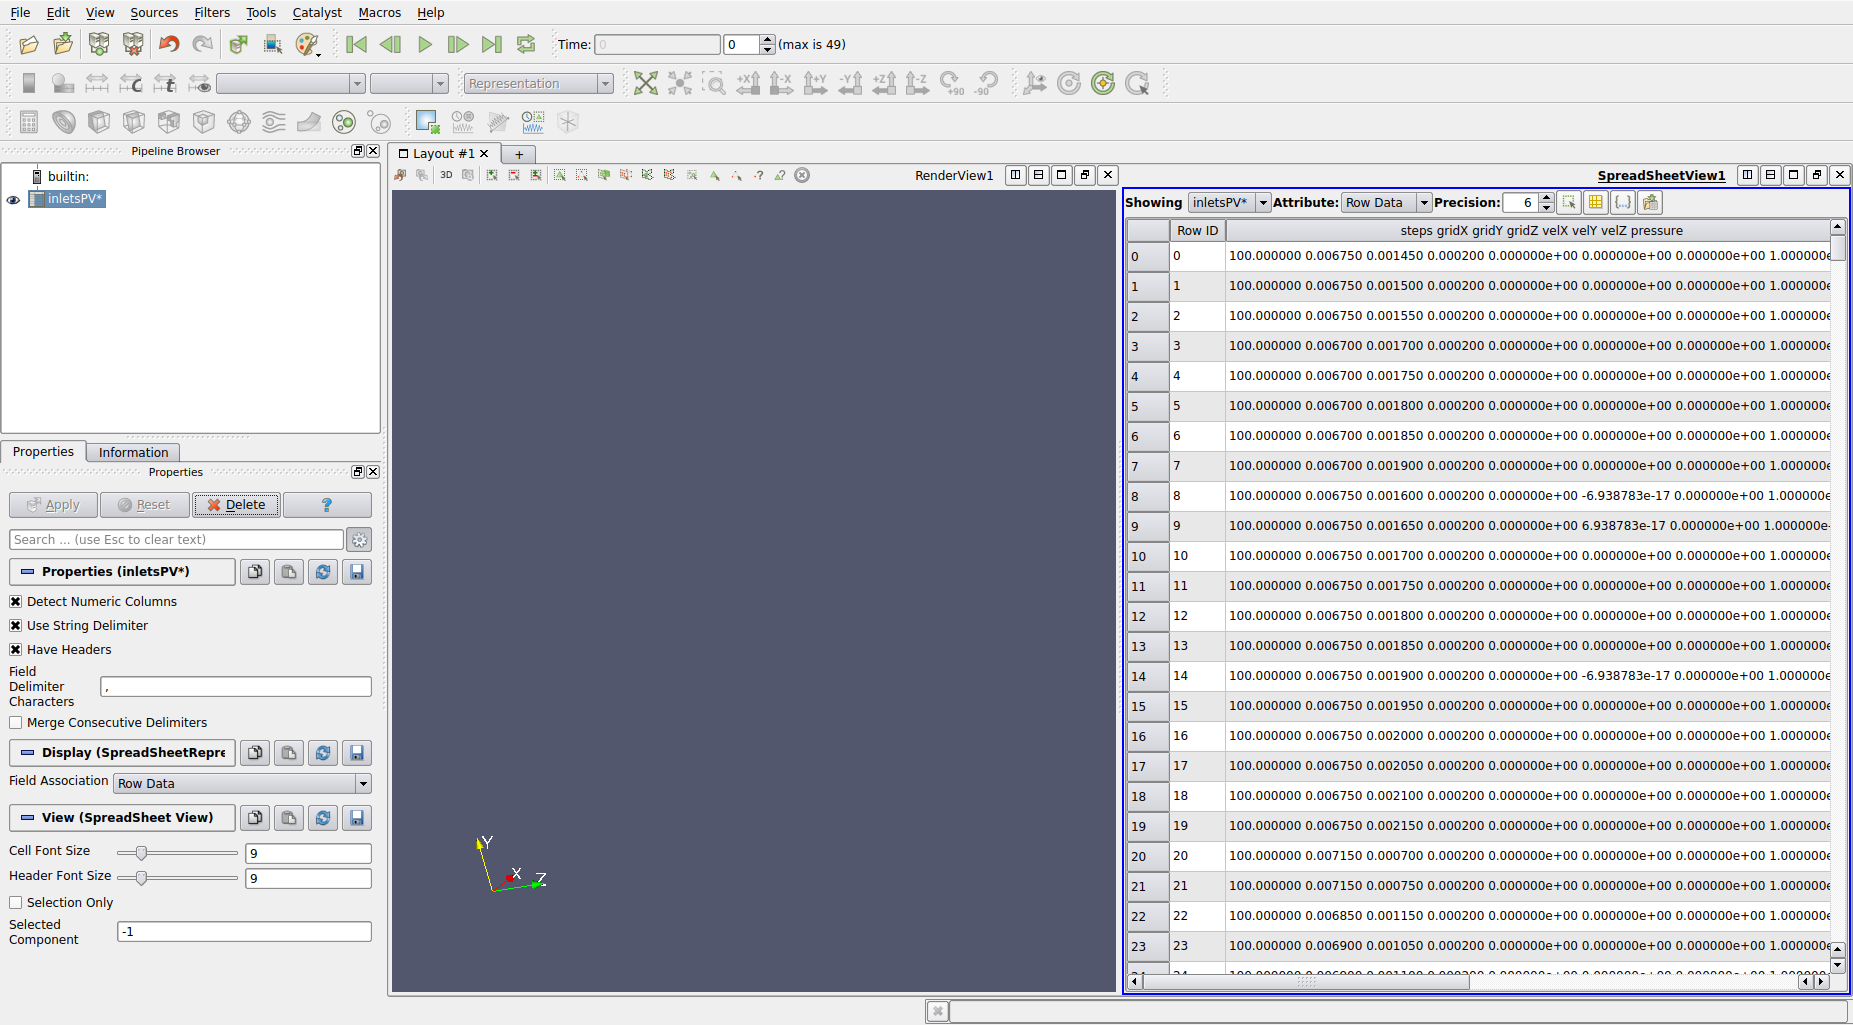
Import paraview-file-nameXX.txt files: File $\rightarrow$ Open $\rightarrow$ Navigate to folder $\rightarrow$ double-click on paraview-file-name..txt (type GROUP)
-
Click green apply button on LHS
-
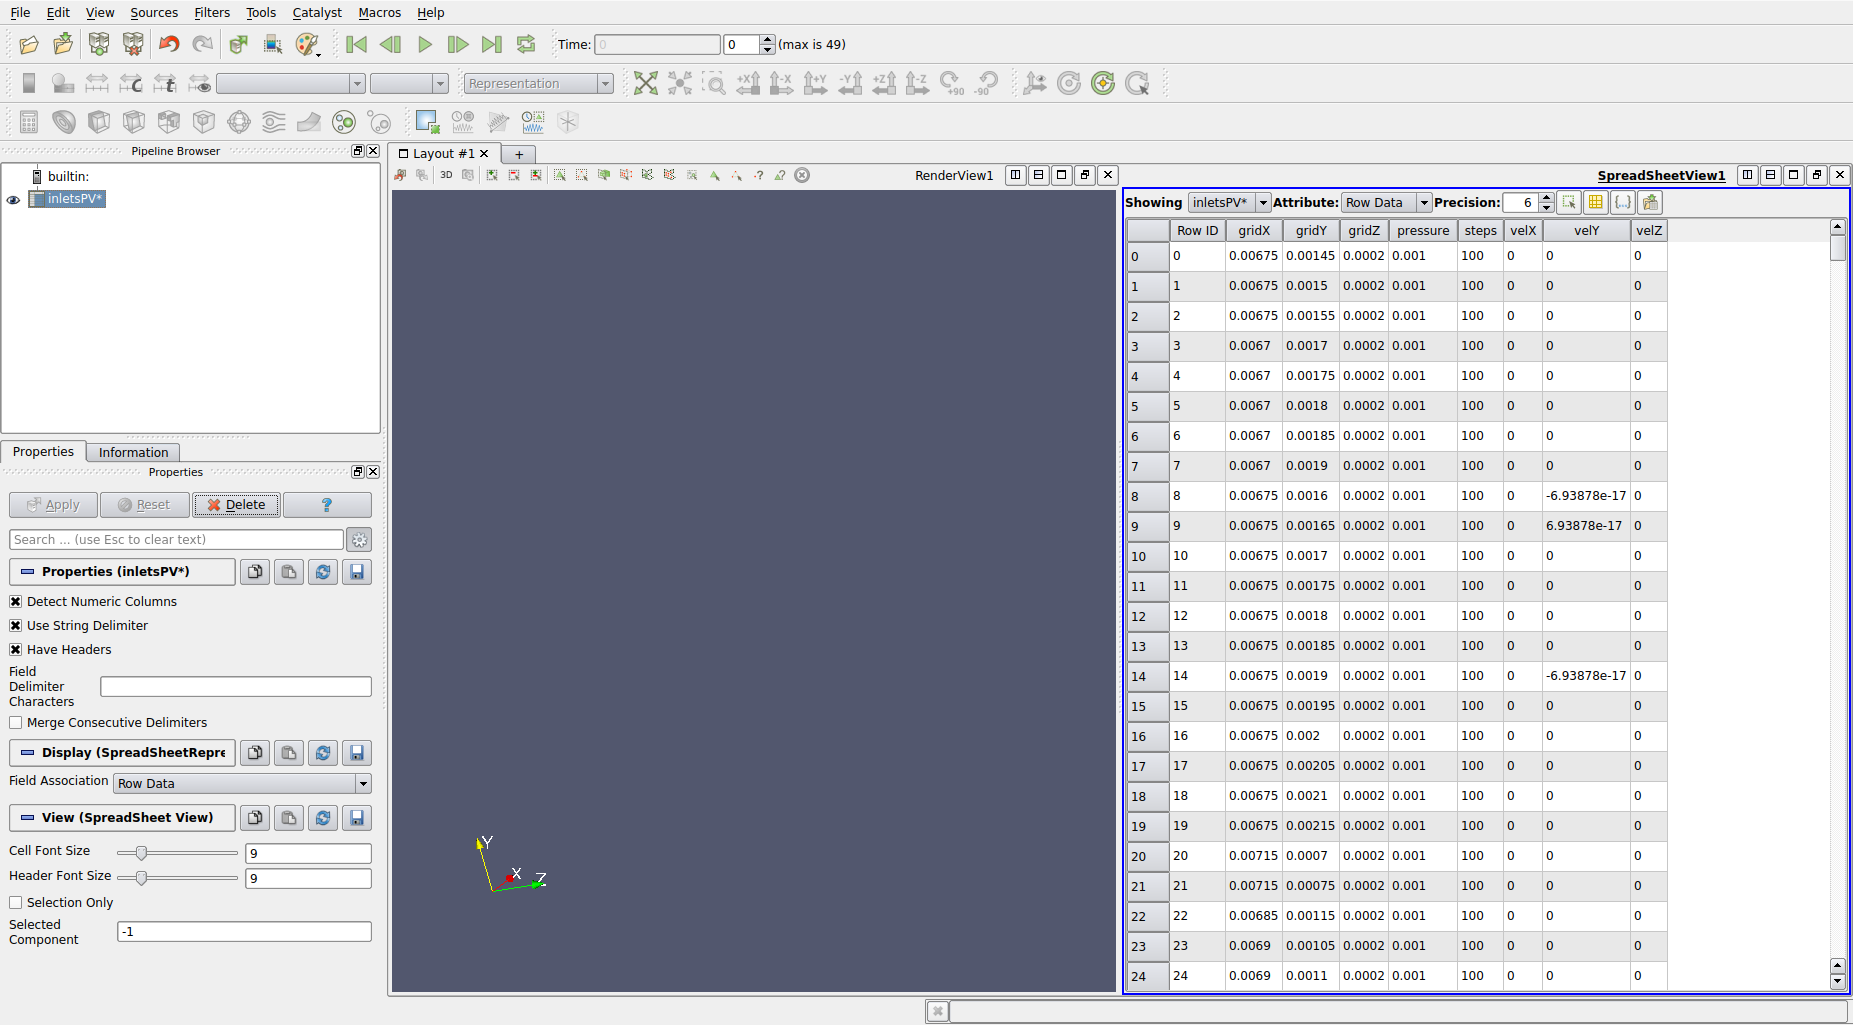
Change default comma (,) in Field Delimeter Characters to a space ( )
-
Click green apply button on LHS (this is a recurring theme in Paraview)
-
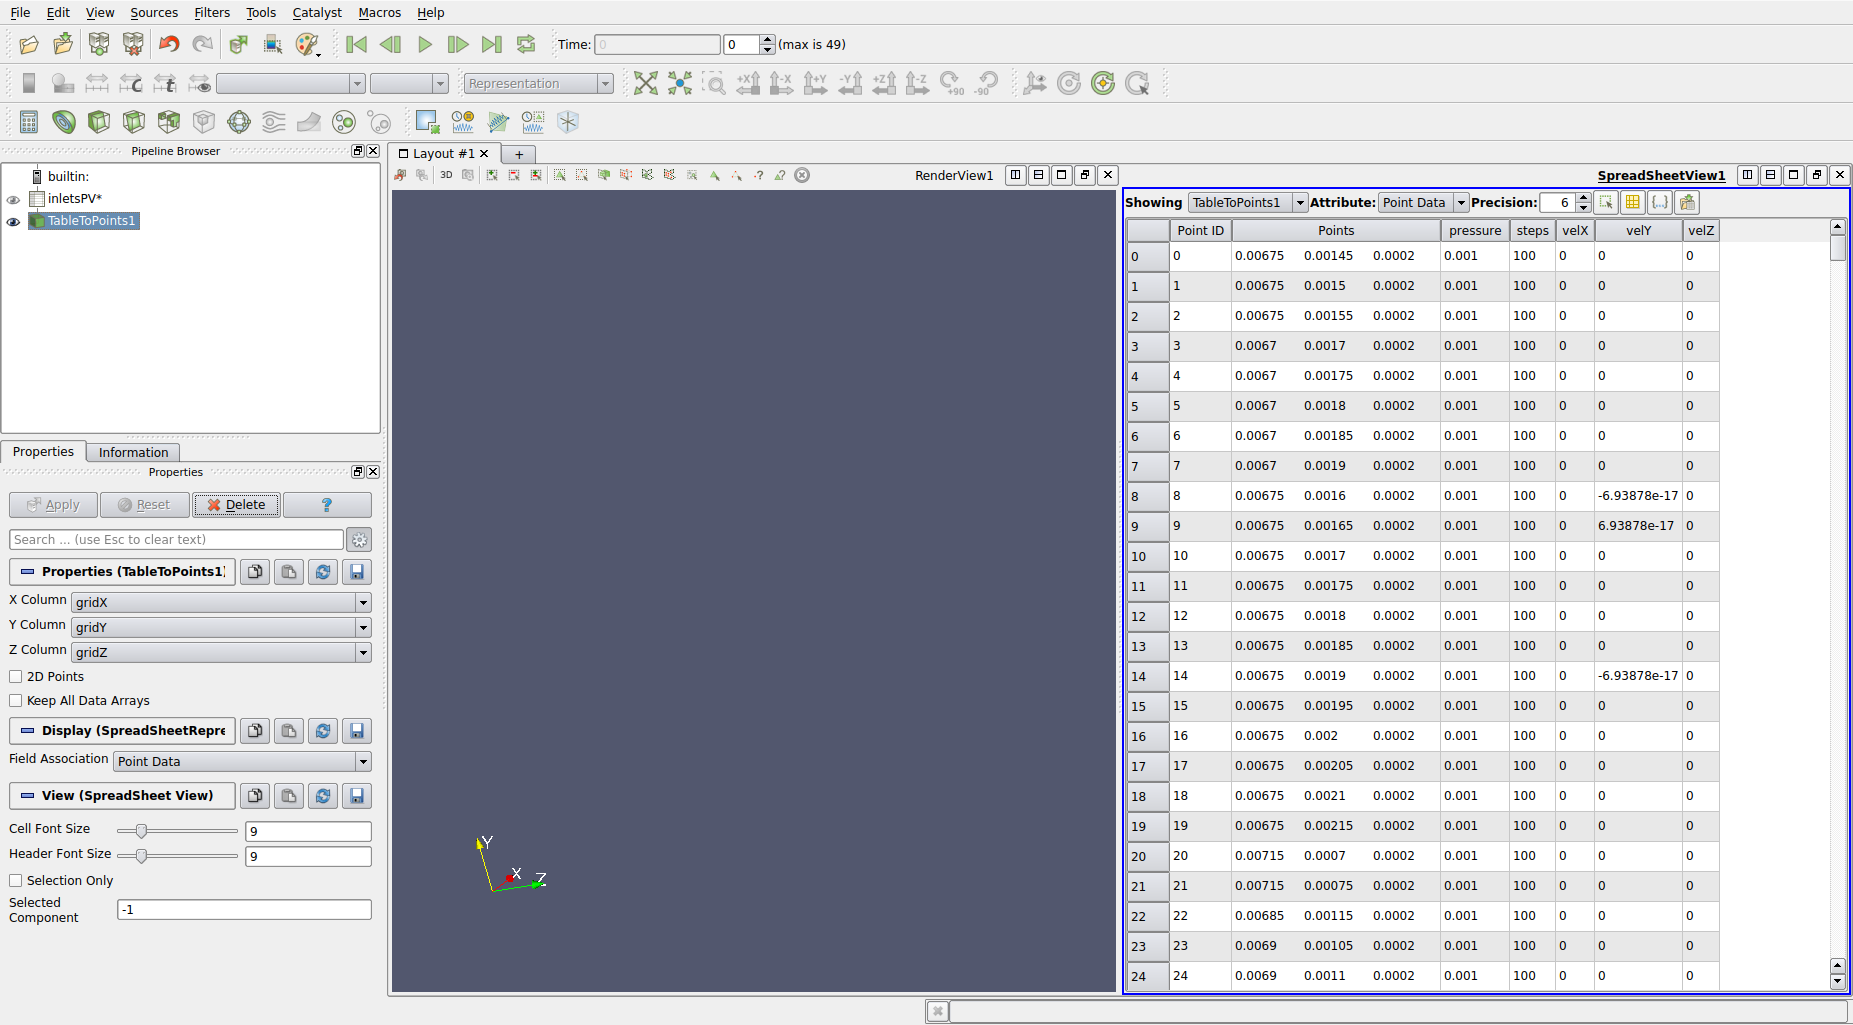
Filters $\rightarrow$ Alphabetical $\rightarrow$ Table To Points
-
Change Y Columns to ‘gridY’ and Z columns to ‘gridZ’
-
Click green apply button on LHS
-
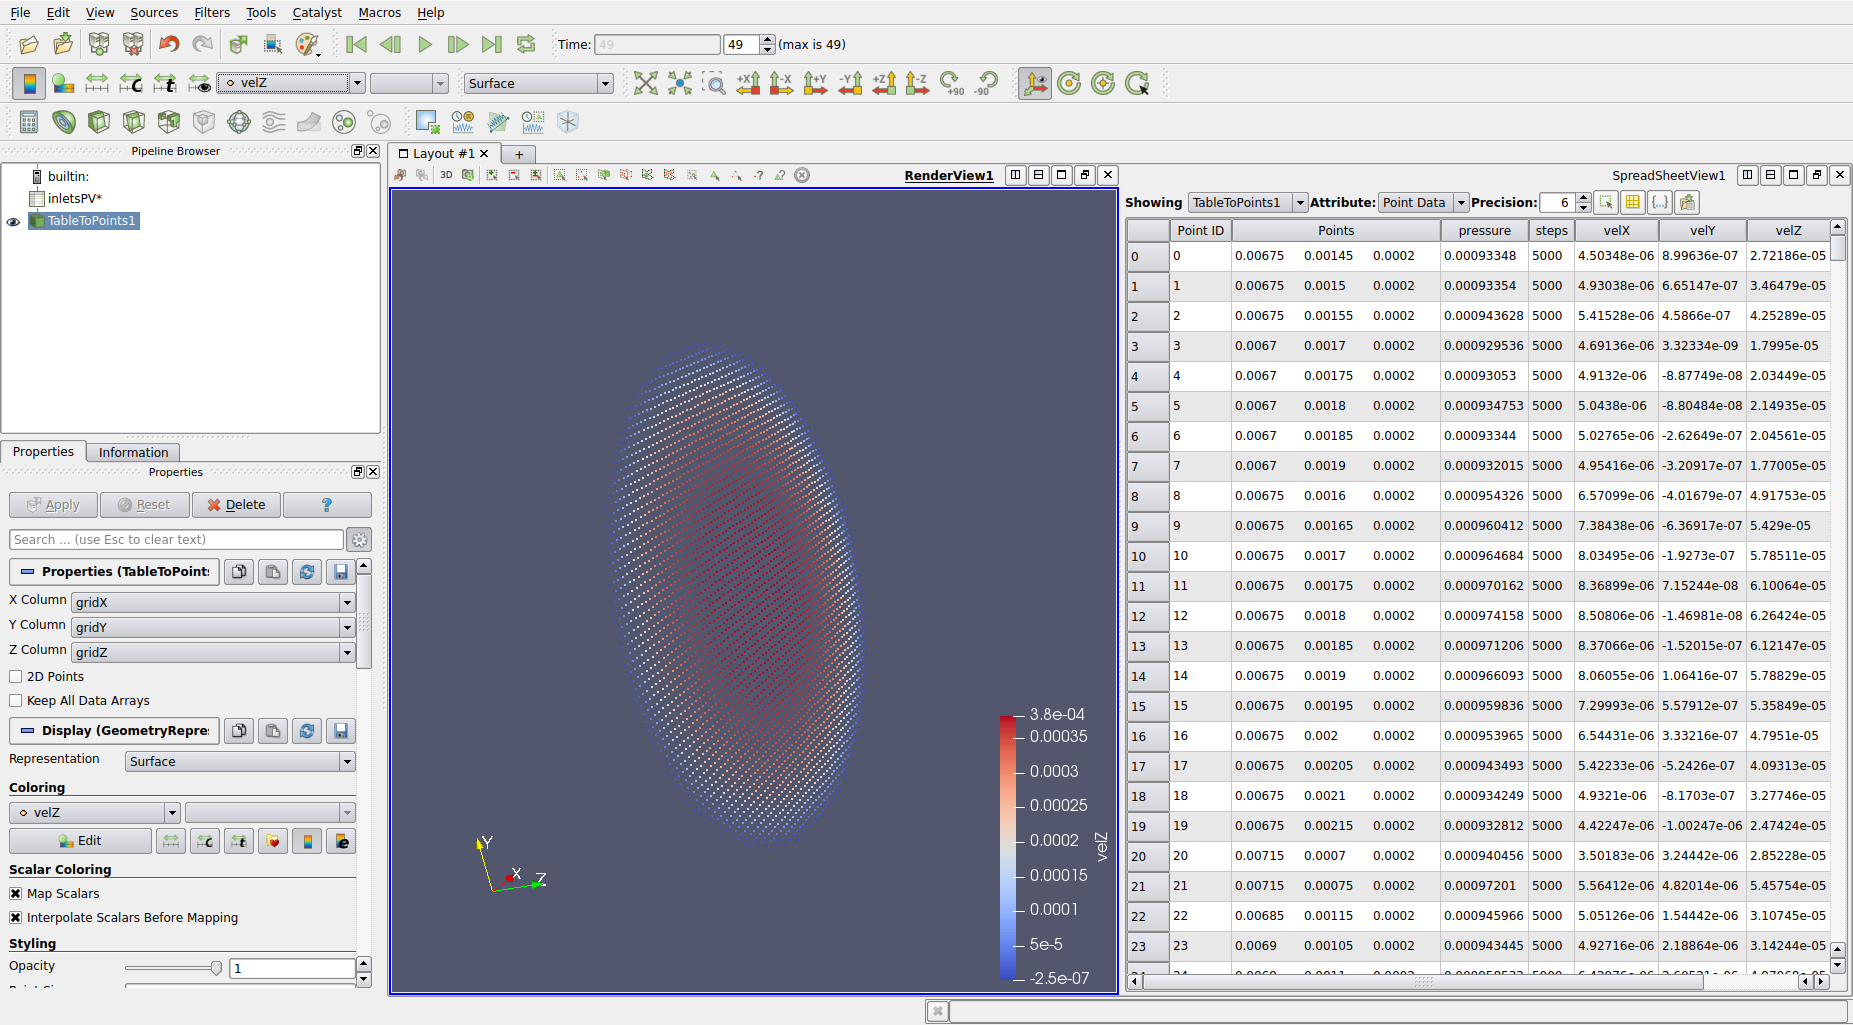
Ensure RenderView panel is active and click on eye next to TableToPoints1 in Pipeline
-
Change rendering option from ‘Solid Colour’ to ‘velZ’
-
Use Play and rescale options to watch time evolution
This is just a basic introduction to Paraview. It is a powerful tool that can permit much more complex visualisation of data.
End of tutorial
You have completed the first simulation tutorial for HemeLB.